You can preview raster images and LiDAR point clouds. For raster images, you can preview images to see the expected output of a compression or manipulation operation. To cancel the rendering of a preview image, click on the Properties or Output tab.
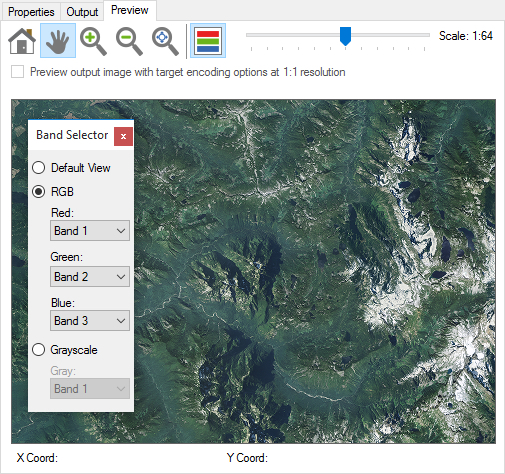
The following figure shows the Preview tab:
X and Y coordinates for the position of the cursor are given below the image pane.
For more information on how to preview an image or mosaic, see Previewing an Image and Previewing a Mosaic.
The Preview tab includes a toolbar that you can use to navigate the preview image. For raster images, you can move the slider in the toolbar to change the scale of the preview image. If you set the scale to 1:1, you can click the check box labeled Preview output image with target encoding options at 1:1. When you select the check box, GeoExpress runs the image compression or manipulation operations on the visible portion of the image.
For multispectral imagery, click the Band selector button  in the toolbar of the Preview tab to manually select the bands that you want to preview. You can select Default View, RGB, or Grayscale. The Default View uses the first three bands of the multispectral image as the RGB bands. To manually select the RGB bands that you want to use, select the RGB option. Click Grayscale to view a single band of the source image as a grayscale image.
NOTE: The Band Selector only affects the image preview. To change the RGB bands used in the encoding process, click Advanced in the Properties tab. Then, select the RGB bands that you want to use in the Bands tab.
LiDAR point clouds are displayed in 3-D. Click the Orbit focal point button ![]() to rotate the image. Click the Refresh points button
to rotate the image. Click the Refresh points button ![]() to clear the preview pane and render the points in the current view again. To render your points quickly, GeoExpress draws a representative sample of your points rather than drawing every single point. If you pan or zoom in, you may want to refresh points to draw more points in the area that you are viewing. To increase or decrease the default number of points that GeoExpress draws, see Viewing Preferences.
to clear the preview pane and render the points in the current view again. To render your points quickly, GeoExpress draws a representative sample of your points rather than drawing every single point. If you pan or zoom in, you may want to refresh points to draw more points in the area that you are viewing. To increase or decrease the default number of points that GeoExpress draws, see Viewing Preferences.
NOTE: To preview a LiDAR point cloud stored as a text file, ensure that you select the option to Read the whole file when the Text Parsing dialog appears.
Click Viewer options to adjust several options that can affect the LiDAR preview. These settings only affect the preview, and not the output file. With the Viewer options dialog open, click Apply to apply changes to the preview and keep the dialog open, click OK to accept all changes and apply them to the preview, or click Cancel to revert the preview and close the dialog.
Check Use RGB colors in file to display the preview with the RGB color information saved with the LiDAR file. (This option will only be present if the file contains RGB metadata. If so, the setting will be enabled by default.)
If you uncheck Use RGB colors,or if the option is not available, the preview will display with a color gradient that indicates elevation, with blue representing the lowest points and red the highest.
If the color gradient for the LiDAR point cloud does not display properly, you may want to adjust the gradient range for the point cloud. Check Use custom gradient range to specify the elevation range for the color gradient. (If the Use RGB colors option is available, you must uncheck it in order for this to take effect.)
For a custom gradient, you can enter the minimum and maximum elevation to color; GeoExpress will recolor the preview using the new range. Elevation units are defined by the vertical projection; for example, the elevation range in NAVD 88-based projections is expressed in meters.
For example, if the point cloud displays as a single color rather than a gradient range of multiple colors, it's likely that one or more points in the point cloud has an incorrect Z value. In this case, you may want to adjust the minimum or maximum Z value used for the gradient.
NOTE: The initial gradient range displayed is the elevation range of points in the image.
You can exaggerate or reduce the effect of elevation differences by changing the Z Exaggeration value. 1 is the true scale, a value of 2 will stretch the height to twice normal, while a value of 0.1 will flatten the image to one-tenth the actual elevation. This value must be greater than 0.
You can specify the Number of points to use for the point cloud preview. Reducing the point count speeds up the preview process at the cost of detail; increaing the point count improves detail at the expense of processing speed.
The Point size indicates the number of screen pixels used to display a single point in the point cloud. You may want to increase this if you dramatically reduce the Number of points used in the preview; using more pixels per point will smooth out a preview that has a low point count.
You can specify what property of the point cloud is represented in the Alpha channel of the preview. The Alpha channel is rendered as transparency.
Use the Keep points where feature to identify a threshold for what points in the point cloud to display. Choose a property from the first pop-up menu (such as Intensity), a relationship from the second (such as ! for NOT), and a enter a relevant value in the text field. For example, specify Z > 1000 to restrict the preview to points whose elevation is over 1000.